|

Weak Signal® Research
Hypothesizing Phase Transitions in the Emergence of Weak Signals
May 15, 1997
by Bryan S. Coffman
Phase Transitions
In chemistry, a phase transition is the border between one state of matter
and another. 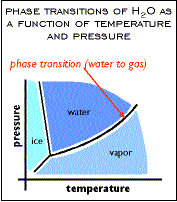 As ice warms above 0º Celsius
it undergoes a phase transition to liquid water. As the temperature increases
to and passes 100° Celsius, liquid water becomes a gas, or steam. A change
in temperature can force a change in the state of H2O. So can a change
in pressure. Water on top of a mountain in Colorado boils at a lower temperature
because the atmospheric pressure is lower. The diagram to the left shows
a "state space" diagram for water at different temperatures
and pressures. The black lines indicate the phase transitions between
ice, water and vapor. We've all witnessed such transitions when observing
ice cubes melting in a glass or when bringing water to a boil on a stove.
If the rate of change of pressure or temperature is rapid, the change
can be quite dramatic. Pouring water on a campfire is an example. If the
temperature or pressure changes gradually, the water will pass the transition
more gradually (depending also on the shape of the curve on the diagram). As ice warms above 0º Celsius
it undergoes a phase transition to liquid water. As the temperature increases
to and passes 100° Celsius, liquid water becomes a gas, or steam. A change
in temperature can force a change in the state of H2O. So can a change
in pressure. Water on top of a mountain in Colorado boils at a lower temperature
because the atmospheric pressure is lower. The diagram to the left shows
a "state space" diagram for water at different temperatures
and pressures. The black lines indicate the phase transitions between
ice, water and vapor. We've all witnessed such transitions when observing
ice cubes melting in a glass or when bringing water to a boil on a stove.
If the rate of change of pressure or temperature is rapid, the change
can be quite dramatic. Pouring water on a campfire is an example. If the
temperature or pressure changes gradually, the water will pass the transition
more gradually (depending also on the shape of the curve on the diagram).
Phase Transitions For Emerging Ideas (Weak Signals)
Perhaps a metaphorical (or real) set of phase transitions occurs as ideas
are discovered or invented, and eventually become popular. If so, then
it would be worthwhile to observe the phenomena around each transition
point, and also the behavior of the idea's emergence between transition
points. Perhaps a certain predictability might be found to help organizations
detect and invest in ideas, or weak signals.
The next diagram is different from the phase diagram for water. We're
hypothesizing that the two phase transitions exist and are related by
time, but we aren't saying anything about what governs them (like changes
in temperature and pressure reveal the phase transitions in water). The
horizontal axis is time: the vertical axis can loosely be labeled "successful
awareness." The higher the idea is on the vertical axis, the more
it has become accepted and integrated into the culture.
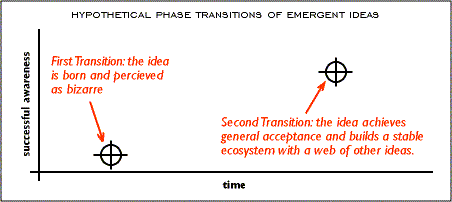
The first phase transition occurs when the idea is born and first perceived.
Chances are that it appears bizarre to the majority of the culture. The
second transition occurs when the idea has achieved acceptance and is
ingrained into the culture as a part of an ecosystem of ideas.
The distance between the two transitions varies based on the idea. Some
new ideas receive market acceptance rapidly. More often, an idea will
take years, decades, or centuries to fully emerge. The readers of this
Journal will are likely familiar with many illustrations of the phenomenon,
like the 3M PostIt Notes story. Most weak signals require other inventions
and infrastructures to support them. The automobile required a network
of roads and service stations in order to proliferate. Some of Leonardo
DaVinci's illustrations went unrealized for centuries.
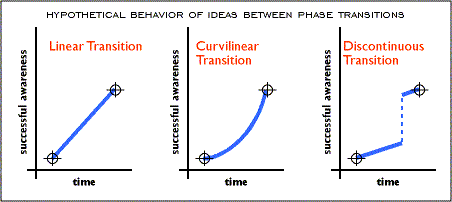
The behavior of the idea between transitions may assume three basic forms,
or any combination of them: linear, curvilinear, or discontinuous. Linear
transitions are probably rare--life just isn't that simple! The curvilinear
growth reflects current understanding of increasing returns and may be
the most common type of intertransition behavior. Discontinuous transitions
involve an abrupt acceptance of the idea that takes everyone by surprise.
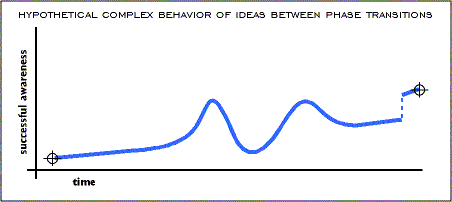
In practice the intertransition curve is probably a compound aggregate
of the three types of curves. Most ideas suffer some sort of setback during
their intertransitional period, so curves with negative slopes may be
added to complete the picture.
Emergence Phenomenon and the Stages of an Enterprise
Model
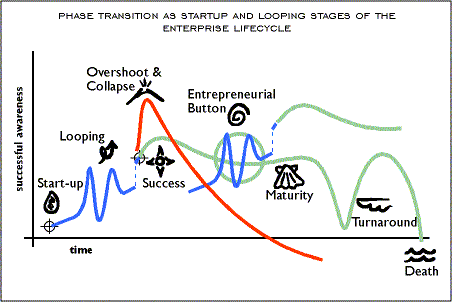
The preceding diagram might look familiar to students of the MG Taylor
Stages of an Enterprise model. In the following diagram, the intertransition
period has been compressed and the rest of the model added onto it with
the stages labeled. The intertransition period begins with the start-up
stage and ends with the success stage. The first phase transition occurs
at start-up and the second at success.
What Next?
This paper presents only a hypothesis based on intuition. No actual data
to confirm or deny the hypothesis has been gathered. Interested readers
might catalog anecdotal support or challenge to the idea. If the hypothesis
has merit, then organizations engaged in weak signal research might benefit
from searching out common phenomenon exhibited at the phase transitions,
and the types of parameters, or simple rules that might influence this
behavior. If the rules can be defined, then sifting through a wide range
of weak signals might be rationalized.
I suspect that the keys to quantifying the hypothesis might be found
in applications of complexity theories and in agent-based computer simulations.
Other information on weak signal research may be found in the Emergent Nodes section of this website.
 
copyright © 1997, MG Taylor Corporation.
All rights reserved
copyrights,
terms and conditions
19970515211228.web.bsc
|

